
Ankerui Qingqing
Jiangsu Ankerui Electric Appliance Manufacturing Co., Ltd. Jiangyin, Jiangsu 2124405
Abstract : This paper introduces the energy management system of Kunshan Hospital of Traditional Chinese Medicine, using smart power meters to collect various electrical parameters and switch signals at the distribution site. The system adopts the on-site local networking method. After networking, it communicates via the field bus and transmits it to the background. The Acrel-3000 energy management system realizes real-time monitoring and power management of the power distribution circuit.
Key words: hospital; Kunshan Hospital; floor; smart power meter; Acrel-3000; power management system
0 Overview
The project of Kunshan Hospital of Traditional Chinese Medicine is located at No. 189, Chaoyang Road, Kunshan City, Jiangsu Province. This project is an energy management system of Kunshan Hospital. According to the requirements of power distribution system management, the power distribution management of the floor distribution box circuits of Kunshan Chinese Medicine Hospital needs to be performed in order to ensure the safety, reliability and efficiency of electricity usage.
Acrel-3000 low-voltage intelligent power distribution system makes full use of the latest developments in modern electronic technology, computer technology, network technology and field bus technology, and performs distributed data collection and centralized monitoring and management of the power distribution system. The secondary equipment of the distribution system is networked. Through the computer and communication network, the field devices scattered on the floor are connected into an organic whole, and the remote monitoring and centralized management of the power grid operation is realized.
1 System Structure Description
The monitoring system mainly implements the 0.4kV power distribution system on the Kunshan Hospital floor for power monitoring and power management. The monitoring scope is the remote real-time monitoring and power management of the floor distribution box circuit. The system has a total of 36 ARCM200L-Z2, divided into 2 busses, and is directly pulled to the monitoring host in the duty room to achieve data connectivity between the instrument on the bus and the monitoring host.
The monitoring system adopts a hierarchical distributed structure, namely station control layer, communication layer and bay layer;
As shown in Figure 1:
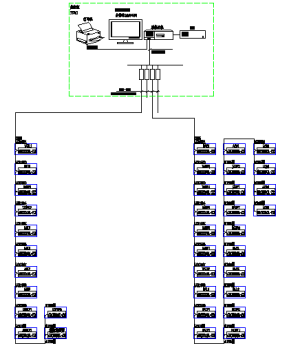
Figure (1) Network topology
Interval device layer is mainly: multi-function network power meter. These devices are corresponding to the corresponding primary equipment installed in the electrical cabinet, these devices are used RS485 communication interface, through the on-site MODBUS bus network communication, data acquisition on the spot.
The main network communication layer is: a conversion isolator, whose main function is to excuse the data line data conversion protocol, and transmit it remotely to the station control layer to complete the data exchange between the field layer and the station control layer.
Station control management: equipped with high-performance industrial computers, monitors, UPS power supplies, printers and other equipment. The monitoring system is installed on the computer to collect and display the operating status of the field equipment and display it to the user in the form of human-computer interaction.
The above network instruments all use RS485 interface and MODBUS-RTU communication protocol. RS485 adopts shielded wire transmission. Generally, two wires are used for connection. The connection is simple and convenient. The communication interface is half-duplex communication, that is, both parties can receive and send data. Only data can be sent or received at the same time. The maximum data transmission rate is 10Mbps.
The RS485 interface is a combination of balanced drivers and differential receivers. It has enhanced noise immunity and allows up to 32 devices to be connected on the bus. The maximum transmission distance is 1.2 km.
2 main functions of the power monitoring system
2.1 Data Acquisition and Processing
Data acquisition is the basis of power distribution monitoring. Data collection is mainly accomplished by the underlying multi-function network instrumentation to achieve local real-time display of remote data. The signals that need to be collected include: three-phase voltage U, three-phase current I, frequency Hz, power P, power factor COSφ, power Epi, and remote device operating status.
Data processing is mainly to display the electrical parameters collected according to requirements in real time and accurately to the user, to achieve the automation and intelligent requirements of the distribution monitoring, and at the same time storing the collected data into the database for user query.
2.2 Human-computer interaction
The system provides simple, easy to use, and good user interface. Using the Chinese interface, the CAD graphic shows the electrical main wiring diagram of the low voltage distribution system, shows the status of the distribution system equipment and the corresponding real-time operating parameters, the screen timing switching tour; dynamic refresh of the screen real-time; analog display; switch display; continuous Record display and so on.
2.3 Diachronic events
The duration event viewing interface provides users with easy and friendly human-computer interaction by viewing the fault records, signal records, operation records, and over-limit recordings that have occurred. You can view the platform through historical events. You can easily locate the fault according to your requirements and query conditions. The historical events that you want to view provide you with good software support for the operation of the entire system.
2.4 Database Establishment and Query
It mainly completes the remote measurement and remote signal acquisition, and establishes a database to generate reports regularly for users to query and print.
2.5 User Rights Management
For different levels of users, different permission groups are set to prevent the losses caused by human misoperation to production and life, and to realize the safe and reliable operation of the distribution system. You can use user management to perform user login, user logout, password change, and add/delete operations to facilitate the user's modification of accounts and permissions.
2.6 Running load curve
The load trend curve function is mainly responsible for regularly collecting incoming lines and important loop current and power load parameters, and automatically generating running load trend curves to facilitate users to know the operating load status of the equipment in a timely manner. Click the corresponding button or menu item of the screen to complete the switching of the corresponding function; you can view the real-time trend curve or historical trend line; you can perform translation, zoom, range conversion and other operations on the selected curve to help the user to enter the trend analysis and fault recall. Analyzing the entire system's operating status provides intuitive and convenient software support.
2.7 Remote Report Query
The main function of the report management program is to design the report style according to the needs of the user, and the data processed in the system is filtered, combined and statistically generated to generate the report data required by the user. This program can also be based on the needs of users of the report file to save, print or summon save, print mode. At the same time, this program also provides users with management functions for generated report files.
The report has the functions of freely setting the query time to realize daily, monthly, and annual energy statistics, data export, and report printing.
3 Case Studies
The Kunshan Chinese Hospital's power management system monitors the floor distribution boxes and manages the electrical distribution loops.
The floor distribution box adopts ARCM200L-Z2 series network power meter. The meter mainly measures all conventional power parameters such as: three-phase voltage, current, active power, reactive power, power factor, frequency, active power, and reactive power. Leakage current.
The secondary diagram of low-voltage power distribution is shown in figure (2). The main function of the power telemetry is to monitor the electrical parameters of the operating equipment, including: three-phase voltage, current, power, power factor, electrical energy, frequency and other electrical parameters and distribution loops. Three-phase current; Remote signal function to display the operating status of the field devices, including: switching of the switch, closing operation status and communication failure alarm.
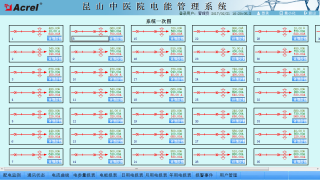
Figure (2) Secondary diagram of low voltage distribution
The remote signaling and telemetry alarm functions mainly complete the monitoring of the switching operation status and load incoming line of the low-voltage outlet loops, and indicate the specific alarm position and audible alarm to the switch displacement and load over-limit pop-up alarm interfaces, prompting the on-duty personnel to deal with them in time. The load limit can be set freely under the corresponding authority. With history query function. See Figure (4).
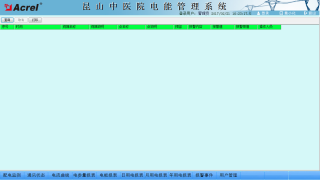
Figure (4) Alarm Information
The parameter reading function mainly inquires into the electrical parameters of the low-voltage outlet circuit. Supports electrical parameter query at any time, with functions such as data export and report printing. The report queries the electrical parameters of the low-voltage loops on the floor, including: three-phase current, active power, active power, and transformer temperature. The names of the loops in this report are associated with the database to facilitate the user to modify the loop name. See Figure (5).
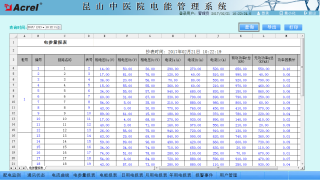
Figure (5) Parameter meter reading
The electricity consumption report function can select the time period to inquire, supports the accumulated electricity inquiry at any time, and has the functions of data export and report printing. Provide accurate and reliable power report for duty personnel. The names of the loops in this report are associated with the database to facilitate the user to modify the loop name. As shown in the figure below, the precise power consumption of each distribution circuit, the user can directly print the report, and can be saved to other locations in EXCEL format. See Figure (6).

Figure (6) Energy Report
The schematic diagram of the system communication structure mainly shows the network structure of the system. The system adopts a hierarchical distributed structure and simultaneously monitors the communication status of the equipment at the bay level. Red indicates normal communication and green indicates communication failure. See Figure (7).
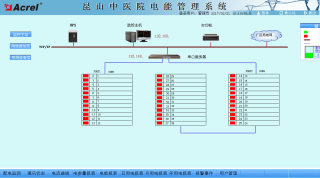
Figure (7) System Communication Structure
The load trend curve interface allows you to visually check the load operation of the loop. View real-time and historical trend curves, click the corresponding button or menu item to complete the switching of corresponding functions; help the user to enter the trend analysis and fault recall, with curve printing function. Provides intuitive and convenient software support for analyzing the health of the entire system. See Figure (8).

Graph (8) Trend Graph
4 Conclusion
With the development of society and the wide application of electricity, the power monitoring system has become an inevitable choice for large-scale multi-substation users, such as key construction projects, landmark buildings, and large-scale public facilities throughout the country. The Acrel-2000/3000 power introduced in this paper The application of monitoring and power management system in Kunshan Chinese Medicine Hospital can realize the real-time monitoring and power management of power distribution circuits on the floor. It can not only show the power status of the circuit, but also has network communication functions, and can be used with serial server, computer, etc. Form a power monitoring system. The system analyzes and processes the collected data, displays the operating status of each distribution circuit in the substation in real time, has a pop-up alarm dialog box and voice prompts for the closing and closing of the load, and generates various energy reports and analysis curves. Graphics, etc., to facilitate remote meter reading and analysis, research. The system is safe, reliable and stable, providing real and reliable basis for users of substations to solve electricity problems and achieving better social benefits. [2]
references:
[1]. Ren Zhicheng, Zhou Zhong. Principles and Application Guides for Digital Meters for Electric Power Measurement [M]. Beijing. China Electric Power Press, 2007. 4
[2].Zhou Zhouzhong, et al. Product Selection and Solution for Smart Grid User-end Power Monitoring and Power Management System[M]. Beijing. Machinery Industry Press. 2011.10
ZHEJIANG HONGDI AUTOMOBILE PARTS CO.,LTD , https://www.hdlotas.com